
Top Customer Service Metrics and How to Track Them
Last updated: February 17, 2026. This update improves the guide with clearer structure, simplified formulas, real-world help desk examples, expanded KPI explanations, and a new FAQ section to address common support team questions.
Customer service metrics are measurable data points that show how well your support team is performing. They track speed, quality, efficiency, and customer satisfaction so you can improve the overall customer experience.
This guide is for IT managers, help desk leaders, customer support directors, and school administrators who want to measure support performance using clear KPIs and reporting tools.
When tracked correctly inside a ticketing system, customer service metrics help you:
- Understand customer sentiment
- Identify process gaps and training needs
- Reduce ticket backlog
- Improve agent productivity
- Increase retention and revenue
Companies that prioritize customer experience consistently outperform competitors. Recent 2025 customer experience research shows that companies with a strong focus on CX and measurable customer outcomes are more likely to grow revenue and loyalty, with many organizations prioritizing CX investments as key drivers of business success.
What Are Customer Service Metrics?
Customer service metrics are key performance indicators, or KPIs, that measure how effectively your support team handles tickets and customer interactions.
They typically fall into four categories:
- Efficiency metrics, such as response time
- Quality metrics, such as resolution rate
- Customer sentiment metrics, such as CSAT and NPS
- Business impact metrics, such as retention and churn
Tracking these metrics in help desk software gives you real-time visibility into performance.
Operational Help Desk Metrics You Should Track
These metrics measure ticket volume, speed, and workload distribution.
Ticket Volume
Ticket volume is the total number of support requests received during a specific time period.
Why it matters:
- Helps forecast staffing needs
- Identifies recurring issues
- Shows seasonal trends
If you see consistent spikes around password resets or shipping questions, you can create knowledge base articles to reduce incoming tickets.
Mojo Helpdesk automatically tracks ticket volume by day, week, or month through built-in reporting dashboards.
Resolution Rate
Resolution rate measures the percentage of tickets successfully solved.
Formula:
Resolved Tickets / Total Tickets × 100
A low resolution rate may indicate:
- Incomplete training
- Escalation bottlenecks
- Poor ticket routing
Using automated ticket assignments and SLA tracking helps increase resolution rates.
Average Resolution Time
Average resolution time measures how long it takes to fully resolve a ticket.
Faster resolution improves satisfaction, but quality should not be sacrificed for speed.
Common causes of slow resolution:
- Manual ticket assignment
- Multiple agents handling the same issue
- Lack of internal documentation
A centralized ticketing system prevents requests from falling through the cracks.
First Response Time
First response time measures how quickly an agent replies after a ticket is submitted.
It does not mean the issue is resolved. It simply confirms the customer has been acknowledged.
Strong benchmarks might include:
- Email within 24 hours
- Social media within 2 hours
- Help desk tickets within 1 hour
Personalized canned responses can help agents respond quickly without sounding robotic.
Ticket Handling Time
Ticket handling time measures how long agents actively work on a ticket.
Formula:
Total Agent Time Spent on Tickets / Total Tickets Handled
This includes:
- Emails
- Chats
- Calls
- Video sessions
Use this metric carefully. Speed is important, but customer satisfaction matters more.
Tickets Per Agent
Tickets per agent measures workload distribution.
Formula:
Total Tickets / Total Agents
If one agent consistently handles far more tickets, your routing rules may need adjustment.
Mojo Helpdesk supports round-robin and load-balanced ticket assignments to distribute work evenly.
Ticket Backlog
Ticket backlog is the number of unresolved tickets at any given time.
A growing backlog usually signals:
- High ticket volume
- Understaffing
- Inefficient workflows
Tracking backlog trends helps you intervene before service levels drop.
SLA Breaches
An SLA, or Service Level Agreement, defines response or resolution time expectations.
An SLA breach occurs when those expectations are missed.
Tracking SLA breaches helps:
- Identify performance gaps
- Protect customer relationships
- Maintain accountability
Learn more about industry SLA standards from the International Customer Service Association.
Mojo Helpdesk includes automated SLA tracking and alerts.
Ticket Analysis Metrics That Improve Efficiency
These metrics help you understand why customers contact you.
Ticket Source
Track where tickets originate:
- Web forms
- Chat
- Phone
- Social media
This helps you prioritize high-volume channels and integrate them into your help desk platform.
Ticket Type or Category
Categorize tickets by type:
- Technical support
- Billing
- Shipping
- Account access
A real-world example: A school IT team noticed 30 percent of tickets were Wi-Fi login issues. They created a knowledge base article and reduced tickets by 18 percent in two months.
Tagging and categorizing tickets makes trend analysis easy.
Replies Per Ticket
Replies per ticket measures how many back-and-forth responses it takes to resolve an issue.
Formula:
Total Replies / Total Tickets
High replies per ticket may indicate missing required fields in your ticket submission form.
First Reply Resolution Rate
This measures how often tickets are resolved on the first response.
Formula:
Tickets Resolved on First Reply / Total Tickets × 100
Improving this metric often requires better training and stronger internal documentation.
Customer Satisfaction and Loyalty Metrics
These metrics measure customer perception.
Customer Satisfaction Score (CSAT)
CSAT measures how satisfied customers are after an interaction.
Typical scale: 1 = Very Unsatisfied 5 = Very Satisfied
Once the results are in, this formula will calculate the CSAT score.
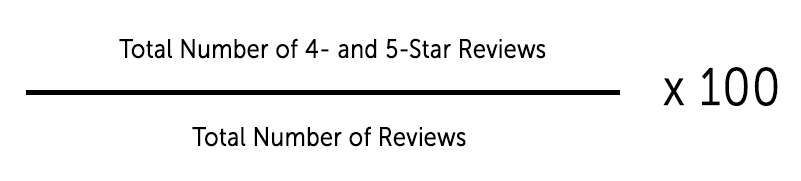
A score above 75 percent is strong in many industries.
Net Promoter Score (NPS)
Net Promoter Score measures customer loyalty.
Customers rate how likely they are to recommend your company on a scale from 0 to 10.
- 9–10 = Promoters
- 7–8 = Passives
- 0–6 = Detractors
Formula:
Percent Promoters − Percent Detractors
NPS was developed by Bain and Company and is widely used across industries.
Customer Effort Score (CES)
Customer Effort Score measures how easy it was to resolve an issue.
Customers respond to statements like:
"My issue was resolved easily."
Lower effort usually correlates with higher retention.
Business Impact Metrics
Support directly affects revenue.
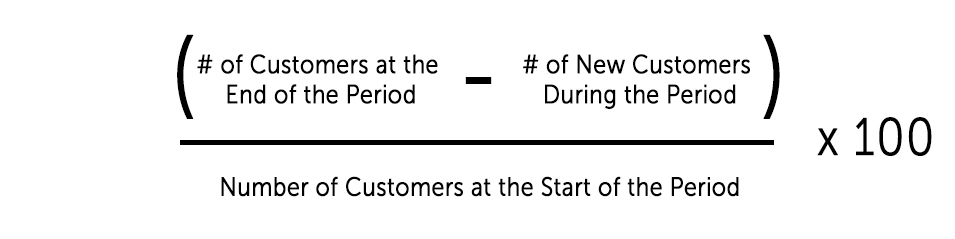
Customer Retention Rate
Retention rate measures how many customers remain over time.
High retention lowers acquisition costs and increases profitability.
Use this equation to calculate the customer retention rate.
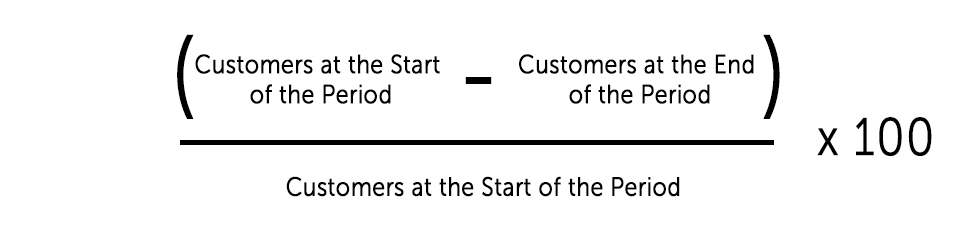
Customer Churn Rate
Churn is the percentage of customers who leave during a given period.
Calculate customer churn rate with this formula.
If churn rises, investigate:
- Product issues
- Pricing changes
- Support quality
Support teams play a critical role in reducing churn.
Cost Per Resolution
Cost per resolution measures how much it costs to resolve one ticket.
Formula:
Total Support Costs / Total Tickets
Lowering replies per ticket and improving automation reduces cost per resolution without harming service quality.
How Do You Track Customer Service Metrics Effectively?
Tracking metrics manually is inefficient and inaccurate.
Follow these best practices:
1. Identify Priority KPIs
Focus on metrics aligned with your goals:
- Faster response times
- Higher satisfaction
- Lower backlog
2. Use Help Desk Software
Professional ticketing software automatically tracks:
- Response times
- SLAs
- Ticket categories
- Agent workload
- CSAT and NPS
Explore Mojo Helpdesk reporting and analytics features to centralize performance tracking.
3. Set Clear Benchmarks
Define measurable goals:
- Reduce first response time by 20 percent
- Improve CSAT to 85 percent
- Lower backlog by 30 percent
4. Create Shareable Reports
Generate dashboards to share with:
- Executives
- IT teams
- Development teams
Sharing metrics improves cross-team alignment.
Turning Support Metrics Into Actionable Insights
Customer service metrics turn support from a cost center into a strategic advantage. By focusing on the right KPIs and using automated reporting tools, you can improve efficiency, increase satisfaction, and strengthen customer retention.
When tracked inside a modern ticketing system like Mojo Helpdesk, these metrics become actionable insights that drive measurable results.